InterTalk Applications
Monitoring System (IAMS)

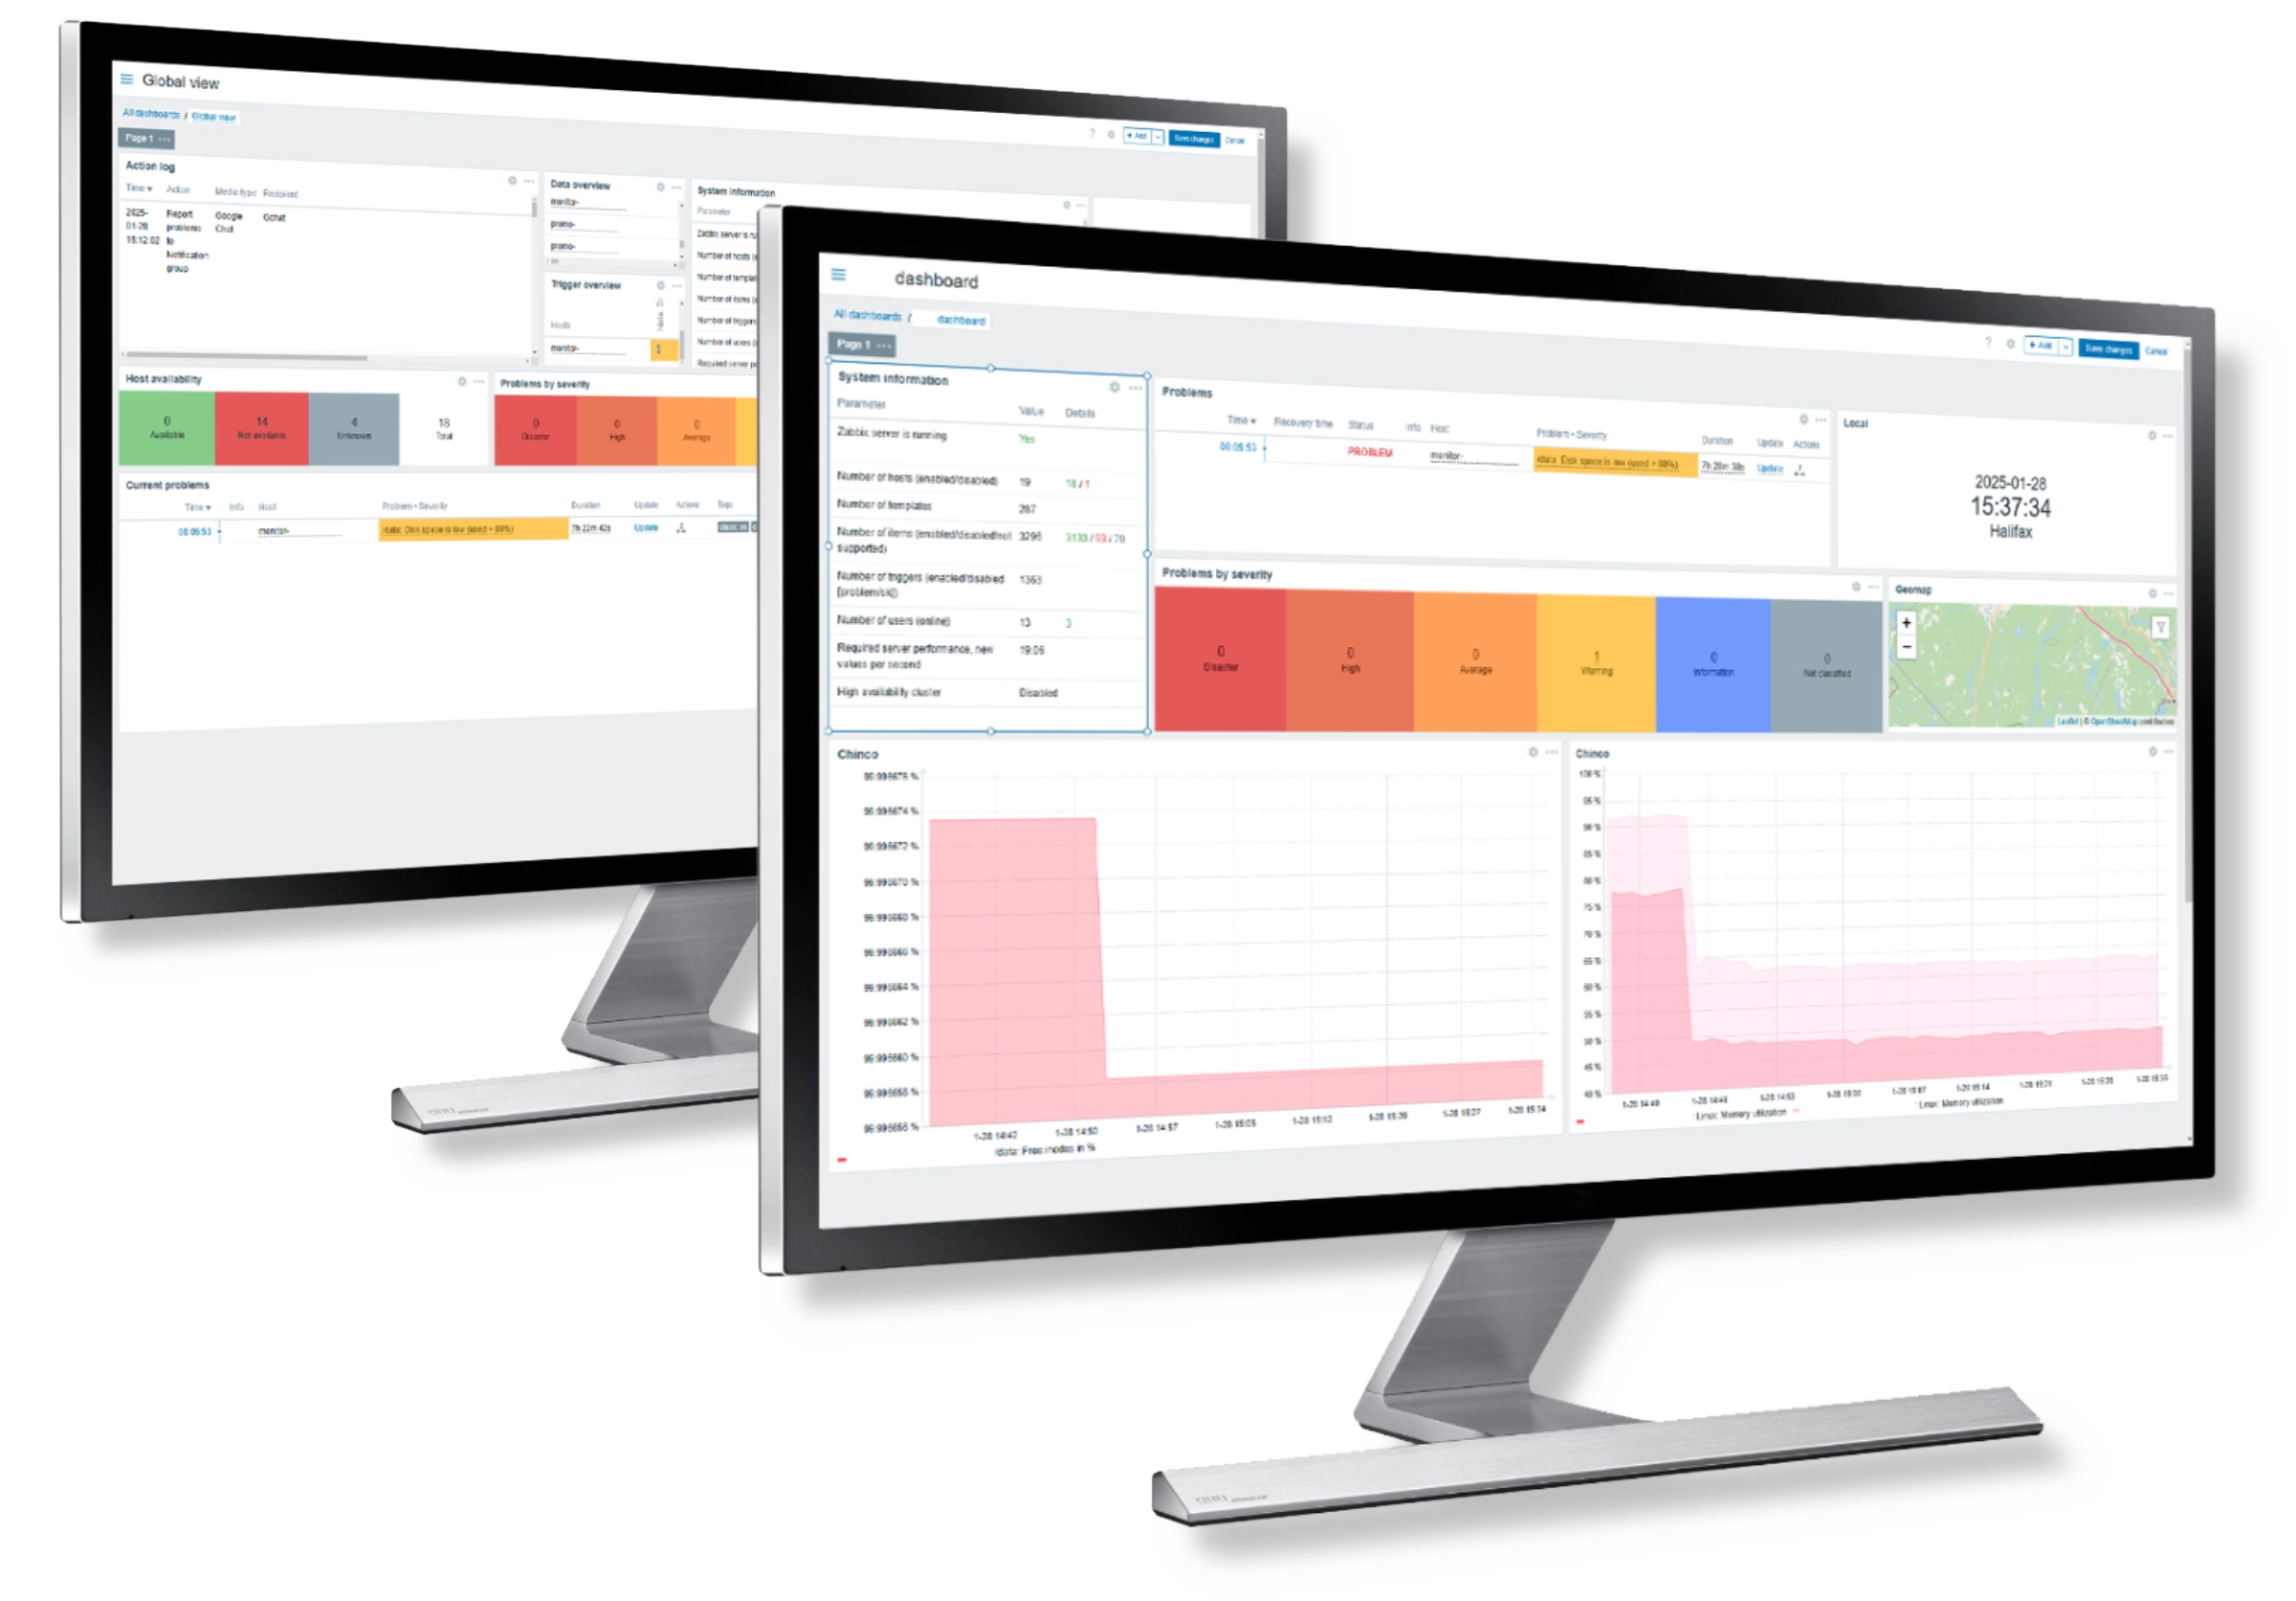
A robust solution designed for comprehensive IT infrastructure monitoring, including networks, servers, and virtual machines.
From tracking device/endpoint uptime to generating configurable alarms and alerts based on critical device metrics (such as CPU load exceeding a specified threshold), IAMS is designed to maintain optimal system performance. It also monitors SSL Certificate expirations and
non-proprietary public software, allowing for alarms based on specific events. The InterTalk dispatch ecosystem leverages the powerful IAMS to monitor its servers, deploying an IAMS agent on each server. This agent collects and sends vital server metrics, including CPU usage, memory, storage, and overall health, to a central IAMS server.

Key Features
Track Device/Endpoint Uptime – Monitor uptime of vital equipment and devices connected to your dispatch system.
Configurable Alarms and Alerts – Configurable alarms and alerts based on critical device metrics (such as CPU load exceeding a specified threshold).
SSL Certificate Expirations – Monitors SSL Certificate expirations and non-proprietary public software, allowing for alarms based on specific events
InterTalk Applications Monitoring System Features
IAMS Features
 Version of IAMS agent running  – Displays the version of the IAMS agent currently running
Version of IAMS agent running  – Displays the version of the IAMS agent currently running Host name of IAMS agent running – Displays the host name of the IAMS agent currently running
Host name of IAMS agent running – Displays the host name of the IAMS agent currently running IAMS agent ping – The agent always returns “1” for this item. May be used in combination with nodata () for the availability check
IAMS agent ping – The agent always returns “1” for this item. May be used in combination with nodata () for the availability check IAMS agent availability  – Used for monitoring the availability status of the agent
IAMS agent availability  – Used for monitoring the availability status of the agent Number of CPUs – Displays number CPUs
Number of CPUs – Displays number CPUs Load average (1m avg) – Calculated as the system CPU load divided by the number of CPU cores
Load average (1m avg) – Calculated as the system CPU load divided by the number of CPU cores Load average (5m avg)  – Calculated as the system CPU load divided by the number of CPU cores
Load average (5m avg)  – Calculated as the system CPU load divided by the number of CPU cores Load average (15m avg)  – Calculated as the system CPU load divided by the number of CPU cores
Load average (15m avg)  – Calculated as the system CPU load divided by the number of CPU cores CPU utilization – CPU utilization expressed in %
CPU utilization – CPU utilization expressed in % CPU idle time – Time the CPU has spent doing nothing
CPU idle time – Time the CPU has spent doing nothing CPU system time – Time the CPU has spent running the kernel and its processes
CPU system time – Time the CPU has spent running the kernel and its processes CPU user time – Time the CPU has spent running users’ processes that are not niced
CPU user time – Time the CPU has spent running users’ processes that are not niced CPU nice time  – Time the CPU has spent running users’ processes that have been niced
CPU nice time  – Time the CPU has spent running users’ processes that have been niced CPU I/O wait time – Time the CPU has been waiting for I/O to complete
CPU I/O wait time – Time the CPU has been waiting for I/O to complete CPU steal time – The amount of “stolen” CPU from this virtual machine by the hypervisor for other tasks, such as running another virtual machine
CPU steal time – The amount of “stolen” CPU from this virtual machine by the hypervisor for other tasks, such as running another virtual machine CPU interrupt time – Time the CPU has spent servicing hardware interrupts
CPU interrupt time – Time the CPU has spent servicing hardware interrupts CPU softirq time – Time the CPU has been servicing software interrupts
CPU softirq time – Time the CPU has been servicing software interrupts CPU guest time – Time spent on running a virtual CPU for a guest operating system
CPU guest time – Time spent on running a virtual CPU for a guest operating system CPU guest nice time – Time spent on running a niced guest (a virtual CPU for guest operating systems under the control of the Linux kernel)
CPU guest nice time – Time spent on running a niced guest (a virtual CPU for guest operating systems under the control of the Linux kernel) Context switches per second  – The combined rate at which all processors on the computer are switched from one thread to another
Context switches per second  – The combined rate at which all processors on the computer are switched from one thread to another Interrupts per second  – Number of interrupts processed
Interrupts per second  – Number of interrupts processed Get filesystems – The vfs.fs.get key acquires raw information set about the filesystems.
Get filesystems – The vfs.fs.get key acquires raw information set about the filesystems. Memory utilization – The percentage of used memory is calculated as 100-pavailable
Memory utilization – The percentage of used memory is calculated as 100-pavailable Available memory in % – The available memory as a percentage of the total
Available memory in % – The available memory as a percentage of the total Total memory – Total memory expressed in bytes
Total memory – Total memory expressed in bytes Available memory – The available memory: in Linux = free + buffers + cache; on other platforms, calculation may vary.
Available memory – The available memory: in Linux = free + buffers + cache; on other platforms, calculation may vary. Total swap space – The total space of the swap volume/file expressed in bytes
Total swap space – The total space of the swap volume/file expressed in bytes Free swap space – The free space of the swap volume/file expressed in bytes
Free swap space – The free space of the swap volume/file expressed in bytes Free swap space in %  – The free space of the swap volume/file expressed in %
 Free swap space in %  – The free space of the swap volume/file expressed in % System uptime – The system uptime expressed in the following format: “N days, hh:mm:ss”
System uptime – The system uptime expressed in the following format: “N days, hh:mm:ss” System boot time – Displays system boot time
System boot time – Displays system boot time System local time  – The local system time of the host
System local time  – The local system time of the host System name  – The host name of the system
System name  – The host name of the system System description – The information as normally returned by uname -a
System description – The information as normally returned by uname -a Number of logged in users  – The number of users who are currently logged in
Number of logged in users  – The number of users who are currently logged in Maximum number of open file descriptors – May be increased by using the sysctl utility or modifying the file /etc/sysctl.conf
Maximum number of open file descriptors – May be increased by using the sysctl utility or modifying the file /etc/sysctl.conf Maximum number of processes – May be increased by using the sysctl utility or modifying the file /etc/sysctl.conf
Maximum number of processes – May be increased by using the sysctl utility or modifying the file /etc/sysctl.conf Number of processes – Shows number of processes
Number of processes – Shows number of processes Number of running processes  – Displays number of processes running
Number of running processes  – Displays number of processes running Checksum of /etc/passwd – Displays Checksum of /ect/passwd
Checksum of /etc/passwd – Displays Checksum of /ect/passwd Operating system  – Displays Operating system
 Operating system  – Displays Operating system Operating system architecture – The architecture of the operating system
Operating system architecture – The architecture of the operating system Number of installed packages   – Displays number of installed packages
Number of installed packages   – Displays number of installed packagesIAMS Triggers
 IAMS agent is not available – For passive agents only, host availability is used with {$AGENT.TIMEOUT} as a time threshold
IAMS agent is not available – For passive agents only, host availability is used with {$AGENT.TIMEOUT} as a time threshold Load average is too high – The load average per CPU is too high. The system may be slow to respond
Load average is too high – The load average per CPU is too high. The system may be slow to respond High CPU utilization – CPU utilization is too high. The system might be slow to respond
High CPU utilization – CPU utilization is too high. The system might be slow to respond High memory utilization – The system is running out of free memory
High memory utilization – The system is running out of free memory Lack of available memory – The system is running out of memory
Lack of available memory – The system is running out of memory High swap space usage – If there is no swap configured, this trigger is ignored
High swap space usage – If there is no swap configured, this trigger is ignored {HOST.NAME} has been restarted – The host uptime is less than 10 minutes
{HOST.NAME} has been restarted – The host uptime is less than 10 minutes System time is out of sync – The host’s system time is different from IAMS server time
System time is out of sync – The host’s system time is different from IAMS server time System name has changed  – The name of the system has changed. Acknowledge to close the problem manually
System name has changed  – The name of the system has changed. Acknowledge to close the problem manually Configured max number of open file descriptors is too low – Configured max number of open file descriptors is too low trigger
Configured max number of open file descriptors is too low – Configured max number of open file descriptors is too low trigger Configured max number of processes is too low – Configured max number of processes is too low trigger
Configured max number of processes is too low – Configured max number of processes is too low trigger Getting closer to process limit  – Getting closer to process limit trigger
Getting closer to process limit  – Getting closer to process limit trigger etc/passwd has been changed – /etc/passwd has been changed trigger
etc/passwd has been changed – /etc/passwd has been changed trigger Operating system description has changed – The description of the operating system has changed
Operating system description has changed – The description of the operating system has changed Number of installed packages has been changed   – Number of installed packages has been changed trigger
Number of installed packages has been changed   – Number of installed packages has been changed triggerDocker Features
 Ping
Ping Get info
Get info Get containers
Get containers Get images
Get images  Get data_usage
Get data_usage Containers total
Containers total Containers running
Containers running  Containers stopped
Containers stopped Containers paused
Containers paused Images total
Images total Storage driver
Storage driver Memory limit enabled
Memory limit enabled Swap limit enabled
Swap limit enabled Kernel memory enabled
Kernel memory enabled Kernel memory TCP enabled
Kernel memory TCP enabled Pids limit enabled
Pids limit enabled IPv4 Forwarding enabled
IPv4 Forwarding enabled  Debug enabled
Debug enabled  Number of used File Descriptors
Number of used File Descriptors OomKill disabled
OomKill disabled Number of goroutines
Number of goroutines Logging driver
Logging driver Cgroup driver
Cgroup driver  NEvents listener
NEvents listener  Kernel version
Kernel version  Operating system
Operating system  Operating system type
Operating system type Architecture
Architecture Memory total
Memory total Docker root dir
Docker root dir Name
Name Server version
Server version Default runtime
Default runtime Live restore enabled
Live restore enabled  Layers size
Layers size Images size
Images size Containers size
Containers size Volumes size
Volumes size Images available
Images availableDocker Triggers
 Service is down  – Service is down trigger
Service is down  – Service is down trigger Failed to fetch info data – IAMS has not received data for items for the last 30 minutes
Failed to fetch info data – IAMS has not received data for items for the last 30 minutes Version has changed – Docker version has changed. Acknowledge to close the problem manually
Version has changed – Docker version has changed. Acknowledge to close the problem manuallyAdditional Features
 IAMS SSL Certificate Monitoring – Monitoring the SSL certificate for the IAMS Server
IAMS SSL Certificate Monitoring – Monitoring the SSL certificate for the IAMS Server IAMS Daily Backup Monitoring  – Monitoring the Daily Backup of the IAMS DB
IAMS Daily Backup Monitoring  – Monitoring the Daily Backup of the IAMS DBNow is the perfect time to arrange a discovery session to help you with your upgrade path.
Get the reliable dispatch radio system you need and want.


Contact
 +1 833 55-ITALK (48255)
 +1 833 55-ITALK (48255)
Headquarters 371 Cutler Avenue
 371 Cutler Avenue
Dartmouth, NS B3B 0J5
Canada
California, USA 1545 River Park Drive, Suite 407
 1545 River Park Drive, Suite 407
Sacramento, California 95815
USA